The Vornado fan remote project left me with an RTL-SDR Blog V4 ($25, secondhand off Craigslist) that had only ever looked at one fan’s 433 MHz remote. I used it for a survey of what’s on the air around me in San Francisco. The V4 covers 500 kHz to 1.766 GHz (datasheet), and I began with the rest of the 433 MHz band, where I could hear three weather sensors. This post covers Aug 3 and 4, 2026: an antenna-length calculation that turned out wrong, a sweep of the tuner gain, an eight-hour census of the band, and a weather sensor whose transmit clock drifts with its own temperature reading.
I’m an electrical engineer but new to software-defined radio, so this was a learning project, done for fun, and a fair amount of it is me finding things out. Where I leaned on outside knowledge I’ve linked it inline. The date and time of every run in this post is in the run table at the end, in local time and UTC, so the numbers about my own captures can be checked too. Where I could, I compared my results against something outside my own captures, such as the antenna kit’s cheat sheet or a crystal datasheet.
The setup is one radio, one antenna and one computer (a Mac mini), pointed at whatever happens to be on the air:
flowchart LR
    A["antenna"] --> B["RTL-SDR dongle\n$25"]
    B --> C["Mac mini\nopen-source decoders"]
    C --> F["weather sensors\n(rtl_433)"]
    C --> E["aircraft\n(dump1090-fa)"]
    C --> D["ships\n(AIS-catcher)"]
Every run in this project used the same dongle with the bias tee off and no external LNA or filter, on the Mac mini, with Homebrew’s librtlsdr 2.0.2 (the mainline library, not the RTL-SDR Blog fork), rtl_433 25.12 for the weather sensors, dump1090-fa 11.1 for aircraft and AIS-catcher v0.70 for ships. I didn’t record where the antenna sat, how high, or which cable it used. My notes have it in a V shape until 08:45:48 PDT on Aug 4 and straight vertical from then on: G1, G2, C1 and C1b were in the V, and I switched it to vertical about 18 minutes into the census (C2). Times are PDT (UTC-7) unless they say UTC; after 17:00 PDT the UTC date is the next day.
From one target to the next I changed the decoder, the tuner gain and the antenna’s element length. The antenna length is where the first mistake was, so I’ll start there.
antenna length: the first calculation was wrong
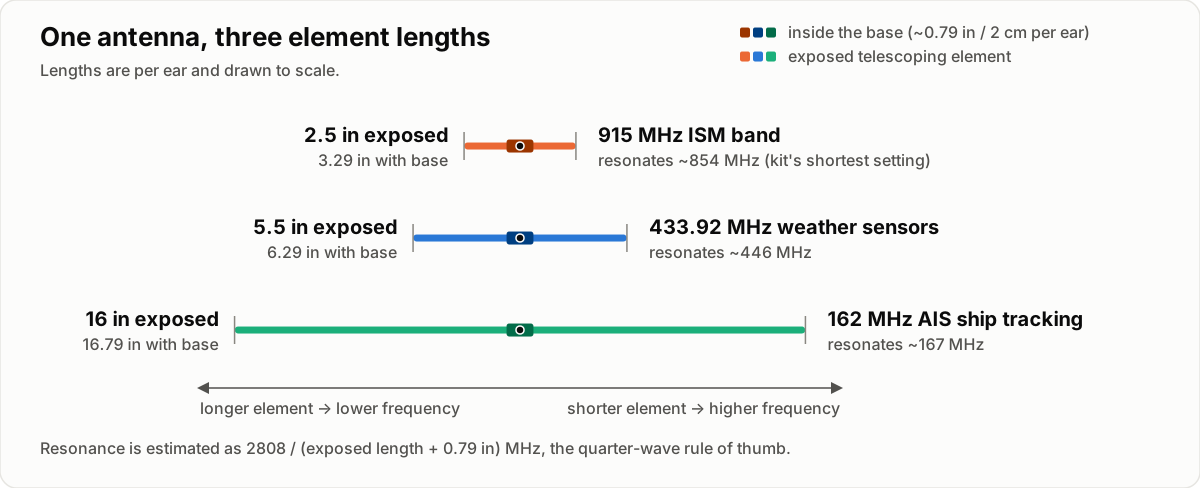
The antenna is the RTL-SDR Blog dipole kit: two telescoping elements on a base. The first calculation of the right length used the bare free-space quarter-wave formula, with no correction for a real wire being shorter than the wave, and no allowance for the roughly 2 cm of metal already inside the antenna base, which the kit’s guide says has to be added on. Both errors pushed the number the same direction, so they added up instead of cancelling, and the wrong answer - “you’re 24% off resonance, extend to 6.8 inches” - looked plausible. Redoing it against the guide and the ham rule of thumb for a quarter wave, 234/f feet with f in MHz (n1fd.org; in practice about 5% shorter than the free-space length, per Wikipedia), gave a different number: 5.7 inches of extension per element for 433.92 MHz. The antenna as built was 5.5 inches, about 3% short of that (it resonates near 446 MHz, about 3% above 433.92 MHz), so there was nothing to fix. I’d been about to lengthen an antenna that was already close.
The corrected formula, extension in inches = 2808/f_MHz - 0.79, is that ham
rule converted to inches (234 x 12 = 2808) minus the 2 cm (0.79 in) in the
base. It matches the length column of the guide’s own cheat sheet to within
0.1 cm on all nine rows, from 70 MHz to 1030 MHz. Shorter element, higher
frequency; longer element, lower frequency - the same direction of rule a
guitar string or a trombone follows, just for radio waves instead of sound
(the kit guide makes the same longer-for-lower point).
For the other bands I used the formula again. The short telescoping elements on my kit bottomed out at about 2.5 inches per element, which resonates near 854 MHz, a little below 915 MHz (where the formula wants about 2.3 inches), so that’s as close as I could get for 915. For AIS, 162 MHz wants about 16.5 inches, which is also what the guide’s cheat sheet lists (42 cm); I set 16 inches using the longer 1-3 foot elements. That makes three lengths for three jobs, as the diagram shows; the run table at the end gives the length for each run in this post.
a gain sweep on the 433 MHz sensors
rtl_433 uses automatic gain by default (its
example config
lists -g as “default: 0 for auto”), and it decodes packets fine that way. To
see what a fixed gain does, I stepped the tuner gain through nine settings
from 16.6 to 44.5 dB, 150 seconds each, with -M level so rtl_433 reports
RSSI, SNR and noise for every packet. That was Aug 3, 21:31 to
21:54 PDT (run G1), with the 5.5 in elements.
Command and settings (run G1)
rtl_433 -f 433.92M -g <gain> -M level -M protocol -M time:iso:usec:tz \
        -F json:data/gain_sweep/gain_<gain>.jsonl
# <gain> = 16.6 19.7 22.9 25.4 28.0 32.8 36.4 40.2 44.5 dB, 150 s each
Those gains are steps in the tuner’s own gain table (librtlsdr source). The loudest sensor was an Oregon-THGR810 (id 106):
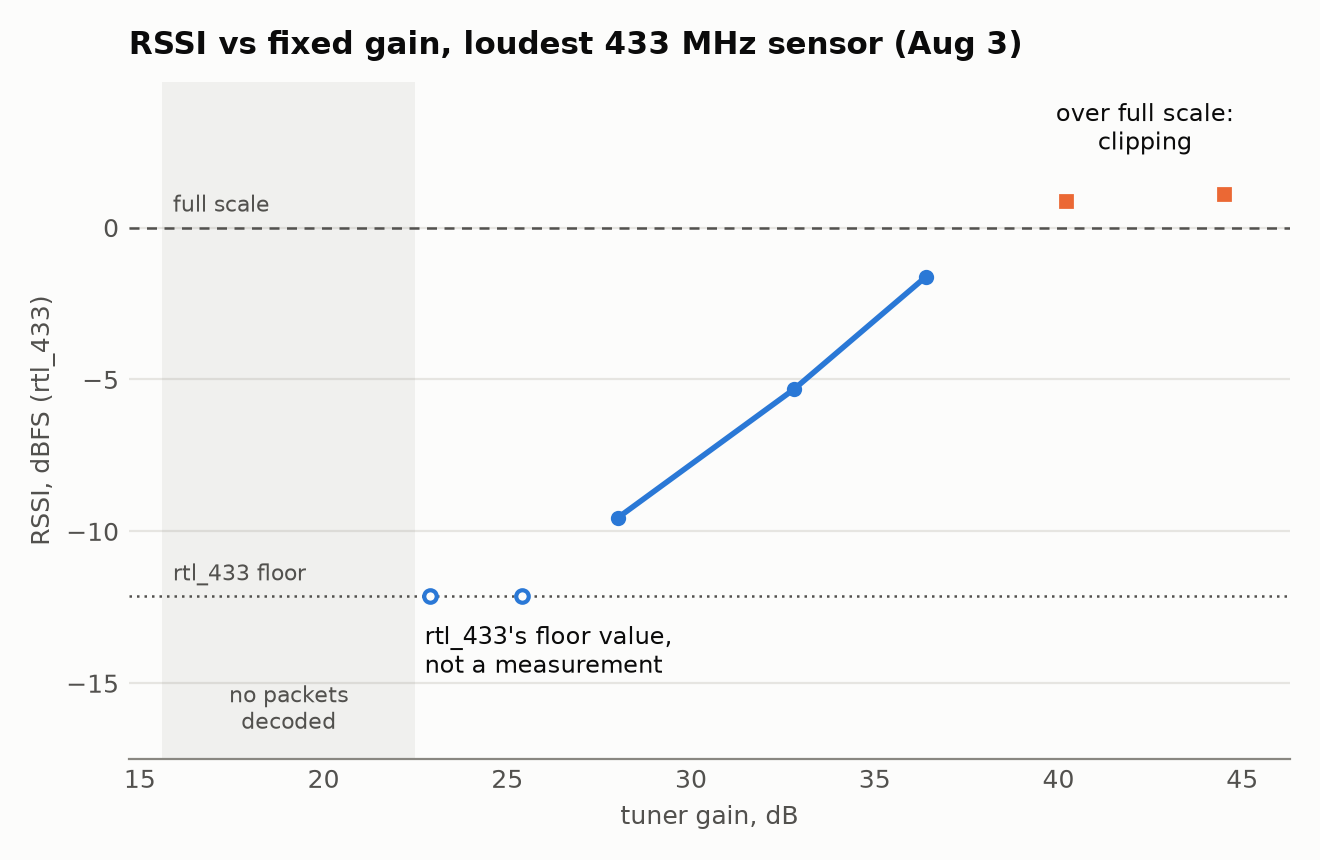
Nothing decoded at 16.6 or 19.7 dB. RSSI (signal level) is in dBFS: decibels
relative to full scale, the loudest signal the dongle can record. At 22.9 and
25.4 dB the RSSI read exactly -12.14 both times, which I later found is
rtl_433’s floor value rather than a measurement (more on that below). From 28.0 to 36.4 dB it rose about 1 dB per dB of gain. At 40.2 and
44.5 dB it went over full scale. As I read it, that’s the receiver clipping,
roughly what an overdriven amplifier does: louder, but distorted. The dongle’s
ADC is only 8 bits
(datasheet),
so as I understand it there isn’t much room between too quiet and too loud.
rtl_433 reports snr = rssi - noise (signal-to-noise ratio) while its level
estimate stays at or below full scale; once the estimate goes over full scale,
RSSI turns positive and the identity stops holding
(calc_rssi_snr).
The packets still decode, but the RSSI can’t be trusted. That snr == rssi - noise test is what the capture script Claude Code wrote uses as a saturated flag. The highest
gain where the loudest sensor stayed below full scale was 36.4 dB, so that
became my “clean” setting.
The interesting part: the “clean” setting, 36.4 dB, heard only one of the three sensors. In a confirmation run of rtl_433 at 36.4 dB (Aug 3, 21:54 to 22:01 PDT, so about seven minutes, run G2) only the loudest sensor decoded. A 9-hour overnight rtl_433 run at 36.4 dB (Aug 3, 22:55 to Aug 4, 08:10 PDT, run C1) heard only that one too, 1,073 packets. Three seconds after the overnight script’s second phase started at 40.2 dB (08:11, run C1b), the second Oregon sensor (id 148) appeared, and the 8-hour census below, at 40.2 dB, heard all three. (An earlier decode pass of about 40 minutes with rtl_433’s defaults, which means automatic gain, had also found all three. The gain it picked wasn’t recorded.) Runs G2, C1 and C1b all used the 5.5 in elements. The cause turned out to be a decoder default I didn’t know about; the explanation is below.
Commands and settings (runs G2, C1, C1b)
G2: the exact command line was not saved. Its output includes records labelled
unknown_ook, the name a flex decoder in one of my earlier scripts gives its
hits, so I think it ran with that decoder as well as rtl_433’s defaults.
C1, the overnight run at 36.4 dB:
rtl_433 -f 433.92M -g 36.4
C1b: the same overnight script’s second phase, switched to 40.2 dB at 08:11:33 PDT. The run table at the end has the exact times.
By default rtl_433 holds its estimate of a signal’s high level at no less than -12.14 dBFS (source) and sets its detection threshold halfway between its noise estimate and that level (source), so it ignores any pulse weaker than about 14 dB below full scale, however clean it is. That’s why the weaker sensors’ RSSI in my logs sits at exactly -12.14, a floor value and not a measurement, and it fits their only appearing once more gain pushed them over the line.
To double-check, I had Claude Code record ten minutes of raw radio samples (IQ)
at 36.4 dB and decode the same file twice. With the default detection level it
found only sensor 106; with a lower one (-Y autolevel) it also found 148,
which sat about 15 dB above the noise, just under the default line. Turning the
recording up and down digitally put the default line at a peak near -14 dBFS and
the lower one near -29.5 dBFS, a difference of about 15 dB.
Commands and settings (the double check)
Capture, 600 s at 250 kS/s, then the same file decoded with rtl_433’s defaults
and with -Y autolevel:
rtl_sdr -f 433920000 -s 250000 -g 36.4 -n 150000000 t1.cu8
rtl_433 -r cu8:t1.cu8 -s 250k -f 433.92M -M level -M time:rel -F json
rtl_433 -r cu8:t1.cu8 -s 250k -f 433.92M -M level -M time:rel -F json -Y autolevel
-Y minlevel=-30 in place of -Y autolevel gave the same result. Each packet’s
peak level was measured straight from the samples (detect_level_ab.py in the
aperture repo), and the turn-up and turn-down test is detect_level_sweep.py.
The antenna wasn’t re-checked for this: it was last set to 9.5 in per element,
vertical, and I don’t know whether it moved in between.
The census rerun mentioned below used the same census script with the gain and detection level changed, for 8 hours over the same seven slices:
GAIN=36.4 EXTRA="-Y autolevel" ./census.sh
Clipping ruins the RSSI measurement without stopping the decode, so at the time
I read it as a reason to run the census at 40.2 dB - deliberately saturating the
loudest sensor - and the saturated column quarantines its bad readings instead
of costing packets from the weaker ones. Given the above, that worked because
the extra gain pushed the weaker sensors over the decoder’s line; a lower
detection level is the other way to hear them.
the 433 MHz band: three sensors above the decoder’s line
For the census (Aug 4, 08:27 to 16:27 PDT, run C2, 5.5 in elements, 40.2 dB) I
stepped rtl_433 through seven 250 kHz slices covering 433.05-434.80 MHz, 90
seconds on each in turn (about 68 minutes per slice over the eight hours),
instead of parking on 433.92 MHz alone. 433.05-434.79 MHz is an ISM band in ITU
Region 1 (Wikipedia); in the US
these low-power sensors operate under FCC Part 15.231
(47 CFR 15.231).
Command and settings (run C2)
rtl_433 -f 433.175M -f 433.425M -f 433.675M -f 433.925M -f 434.175M \
        -f 434.425M -f 434.675M -H 90 -g 40.2 \
        -M level -M protocol -M time:iso:usec:tz -F json
It found the same three emitters the earlier single-frequency decodes had: two sensors rtl_433 labels Oregon-THGR810 and one it labels LaCrosse-TX141THBv2. Nothing turned up anywhere else in the band except one packet at 434.173 MHz carrying the loudest sensor’s ID. I first took it for splatter from that sensor’s clipped signal, but the timestamps say otherwise: with 90-second hops from 08:27:56, a hop from the 433.925 slice to 434.175 was due at 14:20:26, and the packet arrived at 14:20:27, right on that sensor’s usual 31-second beat. Every other packet in the census landed while the hopper sat on 433.925. So it looks like the sensor was caught mid-hop and stamped with the new slice’s frequency, not a fourth device. The census confirmed the count instead of finding anything new, though like every decode here it couldn’t see a signal whose peak was weaker than about 14 dB below full scale. I reran it later with a lower detection level, and it found the same three sensors and nothing else.
a sensor’s transmit clock tracks its temperature
One side effect of watching the sensors for hours: as far as I can tell, Oregon
Scientific sensors usually pick a new random ID when they’re reset or their
battery is swapped
(a third-party protocol write-up,
an rtl_433 discussion),
which makes id a shaky way to tell sensors apart. A crystal’s frequency
offset is a property of the hardware and shouldn’t change with the ID (I didn’t
swap a battery to test that), so I tried the transmit period as an identity key
instead. Fitting t = t0 + period*i to packet arrival times (i is the packet
number) gives each sensor’s clock offset to about 1 ppm from 22 minutes of data
and to 0.006 ppm from 4 hours. The two Oregon sensors came out about 13 to 15
ppm apart in three datasets (15 ppm in the 22-minute gain sweep, 12.9 ppm in
the census, 14.3 ppm in another run), which is plenty of separation to key on
at similar temperatures. Across seasons I’d expect to need a tolerance band, or
a correction using each sensor’s reported temperature. One
datasheet
for a 32.768 kHz tuning-fork crystal allows a frequency tolerance of ±20 ppm at
25 °C, a likely reason two sensors sit 13 to 15 ppm apart, and a reason two
could land close together.
The period also drifts with the temperature the sensor reports. Fitting every packet of the overnight run (run C1, Aug 3-4, 14.3 to 16.7 °C) gives -0.640 ± 0.006 ppm per °C (the ± is only the fit’s statistical error over a 2.4 °C range): as it warms, the period gets about 0.64 ppm shorter per degree. At that slope, a temperature difference of roughly 20 °C between two sensors could erase a 13 to 15 ppm separation. The same datasheet gives a parabolic curve with a turnover near 25 °C and a curvature of about -0.034 ppm/°C², which works out to about -0.67 ppm/°C at 15 °C. The fit is within about 5% of that nominal curve, but that’s partly luck: the datasheet allows part-to-part variation, so a crystal within spec could have a slope anywhere from about -0.3 to -1.2 ppm/°C at 15 °C. I’d say the fit is consistent with a tuning-fork crystal, not that it matches this particular one. (The timestamps come from the Mac’s clock, and I don’t know whether it was NTP-synced, so the absolute ppm values are relative to that clock; the difference between the two sensors doesn’t depend on it.)
Every quartz crystal’s frequency changes a little with temperature; Wikipedia calls temperature the main cause of frequency variation in crystal oscillators. It’s the same effect that makes a quartz watch run a little slow when it’s much colder or hotter than room temperature: a watch crystal is designed to run fastest around 25 °C, and the same article puts it at about 3.5 ppm slow, roughly 0.3 seconds a day, at 10 °C away from that. In this sensor the effect is large enough to see in the packet timing over a night:
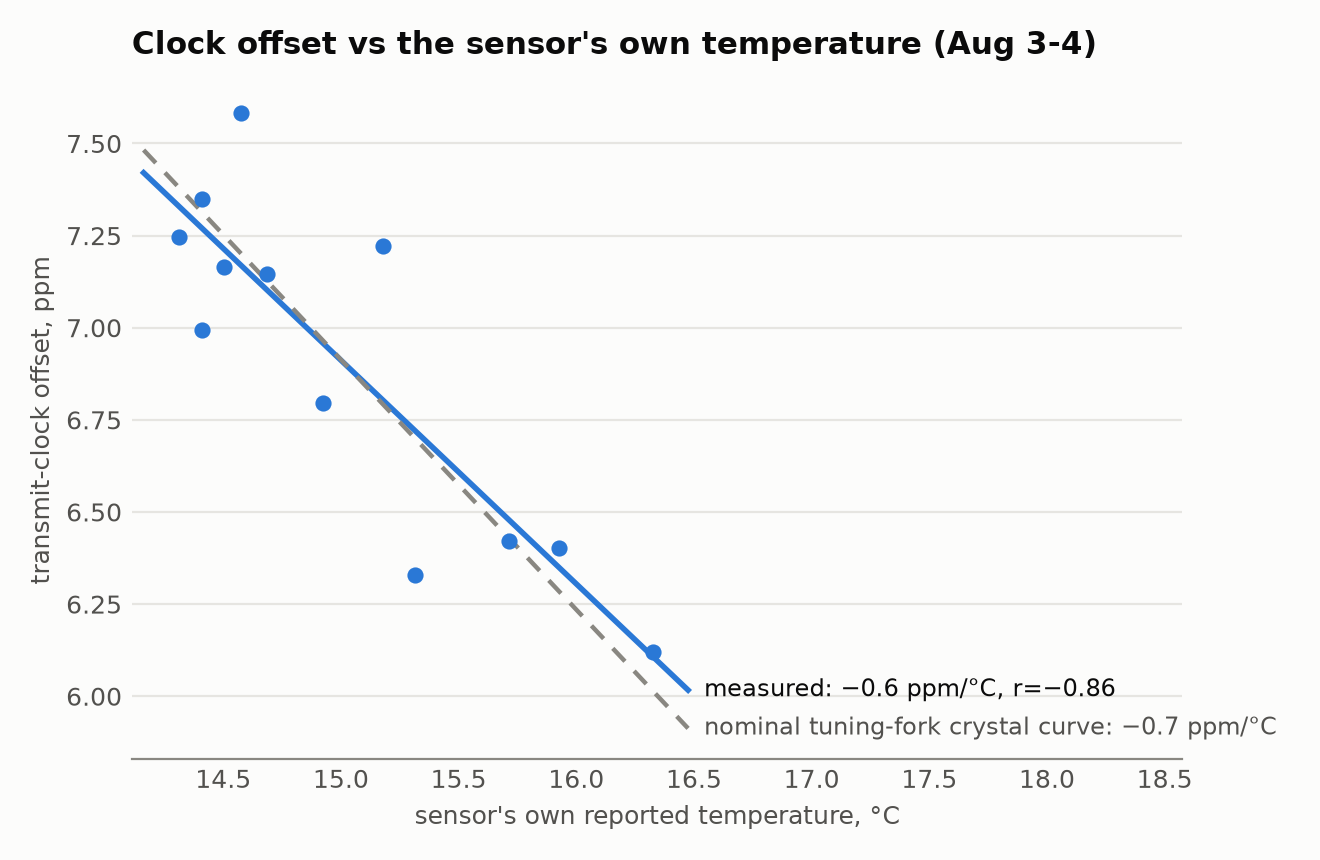
The chart splits the night into 45-minute windows (slope about -0.6 ppm/°C, r = -0.86), and the dashed line is the nominal tuning-fork curve. The -0.640 figure above comes from a fit to every packet instead, which doesn’t depend on where the windows are cut.
Every run mentioned in this post (times in PDT and UTC)
All times are 2026. PDT is UTC-7, so after 17:00 PDT the UTC date is the next day. The IDs are only for cross-reference with the text. Antenna is the exposed length per element (the change from a V shape to vertical is in the setup paragraph at the top). Times come from log files and from file creation and modification times. G2’s exact command line was not saved. The earlier decode pass of about 40 minutes, the “another run” that gave 14.3 ppm, the double check and the census rerun are mentioned in the text without run IDs and are not in this table (the last two are in the aperture repo’s FINDINGS, section 38). Not recorded at all: the antenna’s placement, height and cable.
| ID | run | PDT | UTC | antenna |
|---|---|---|---|---|
| G1 | gain sweep, 9 gains x 150 s | Aug 3 21:31:01 - 21:53:34 | Aug 4 04:31:01 - 04:53:34 | 5.5 in |
| G2 | 36.4 dB confirmation run | Aug 3 21:54:07 - 22:01:07 | Aug 4 04:54:07 - 05:01:07 | 5.5 in |
| C1 | overnight 433.92 MHz at 36.4 dB | Aug 3 22:55:39 - Aug 4 08:10:00 | Aug 4 05:55:39 - 15:10:00 | 5.5 in |
| C1b | same run, switched to 40.2 dB | Aug 4 08:11:33 - 08:23:17 | Aug 4 15:11:33 - 15:23:17 | 5.5 in |
| C2 | 433 MHz census, 7 slices, 40.2 dB | Aug 4 08:27:56 - 16:27:57 | Aug 4 15:27:56 - 23:27:57 | 5.5 in |
more from this project
This is one of four posts from the same RTL-SDR project. One thread runs through all four: more than once, what I was chasing turned out to be my own tools, from the dongle’s DC spike to a clipping front end to a decoder’s default threshold. The other three:
- aperture: tracking ships and aircraft over SF Bay with a $25 SDR dongle - three AIS runs and two ADS-B runs, with times and links so they can be checked (Aug 6-7 and Sep 25)
- aperture: what’s on the air from 500 kHz to 1.77 GHz - a full-spectrum sweep, whether strong FM stations overload the receiver, and an AM station that was an empty channel (Aug 3 to Sep 24)
- aperture: the mystery signal at 916 MHz was my own dongle - a 916 MHz “carrier” that looked like LoRa and turned out to be the dongle’s own DC spike, plus a 2-hour hopping decode (Aug 3 to Sep 25)
How this was built: Claude Code wrote the capture scripts, the analysis and the figures, and drafted this post from our session logs. I set the antenna lengths, moved the antenna, directed every run, reviewed the results, and chose what to check against outside sources. Tested: every measurement here is from a run on the dongle, listed in the table except where the text says otherwise. Not tested: whether the clock fingerprint survives a battery swap, and how well the weak sensors are heard over a full day at the lower detection level.